make_gaussian_sources_image
- photutils.datasets.make_gaussian_sources_image(shape, source_table, oversample=1)[source]
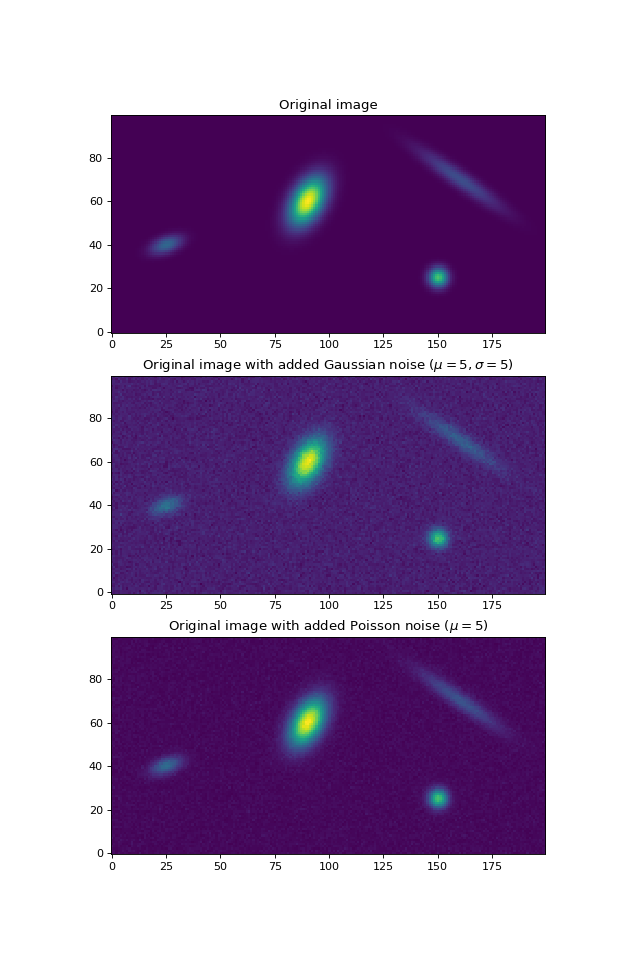
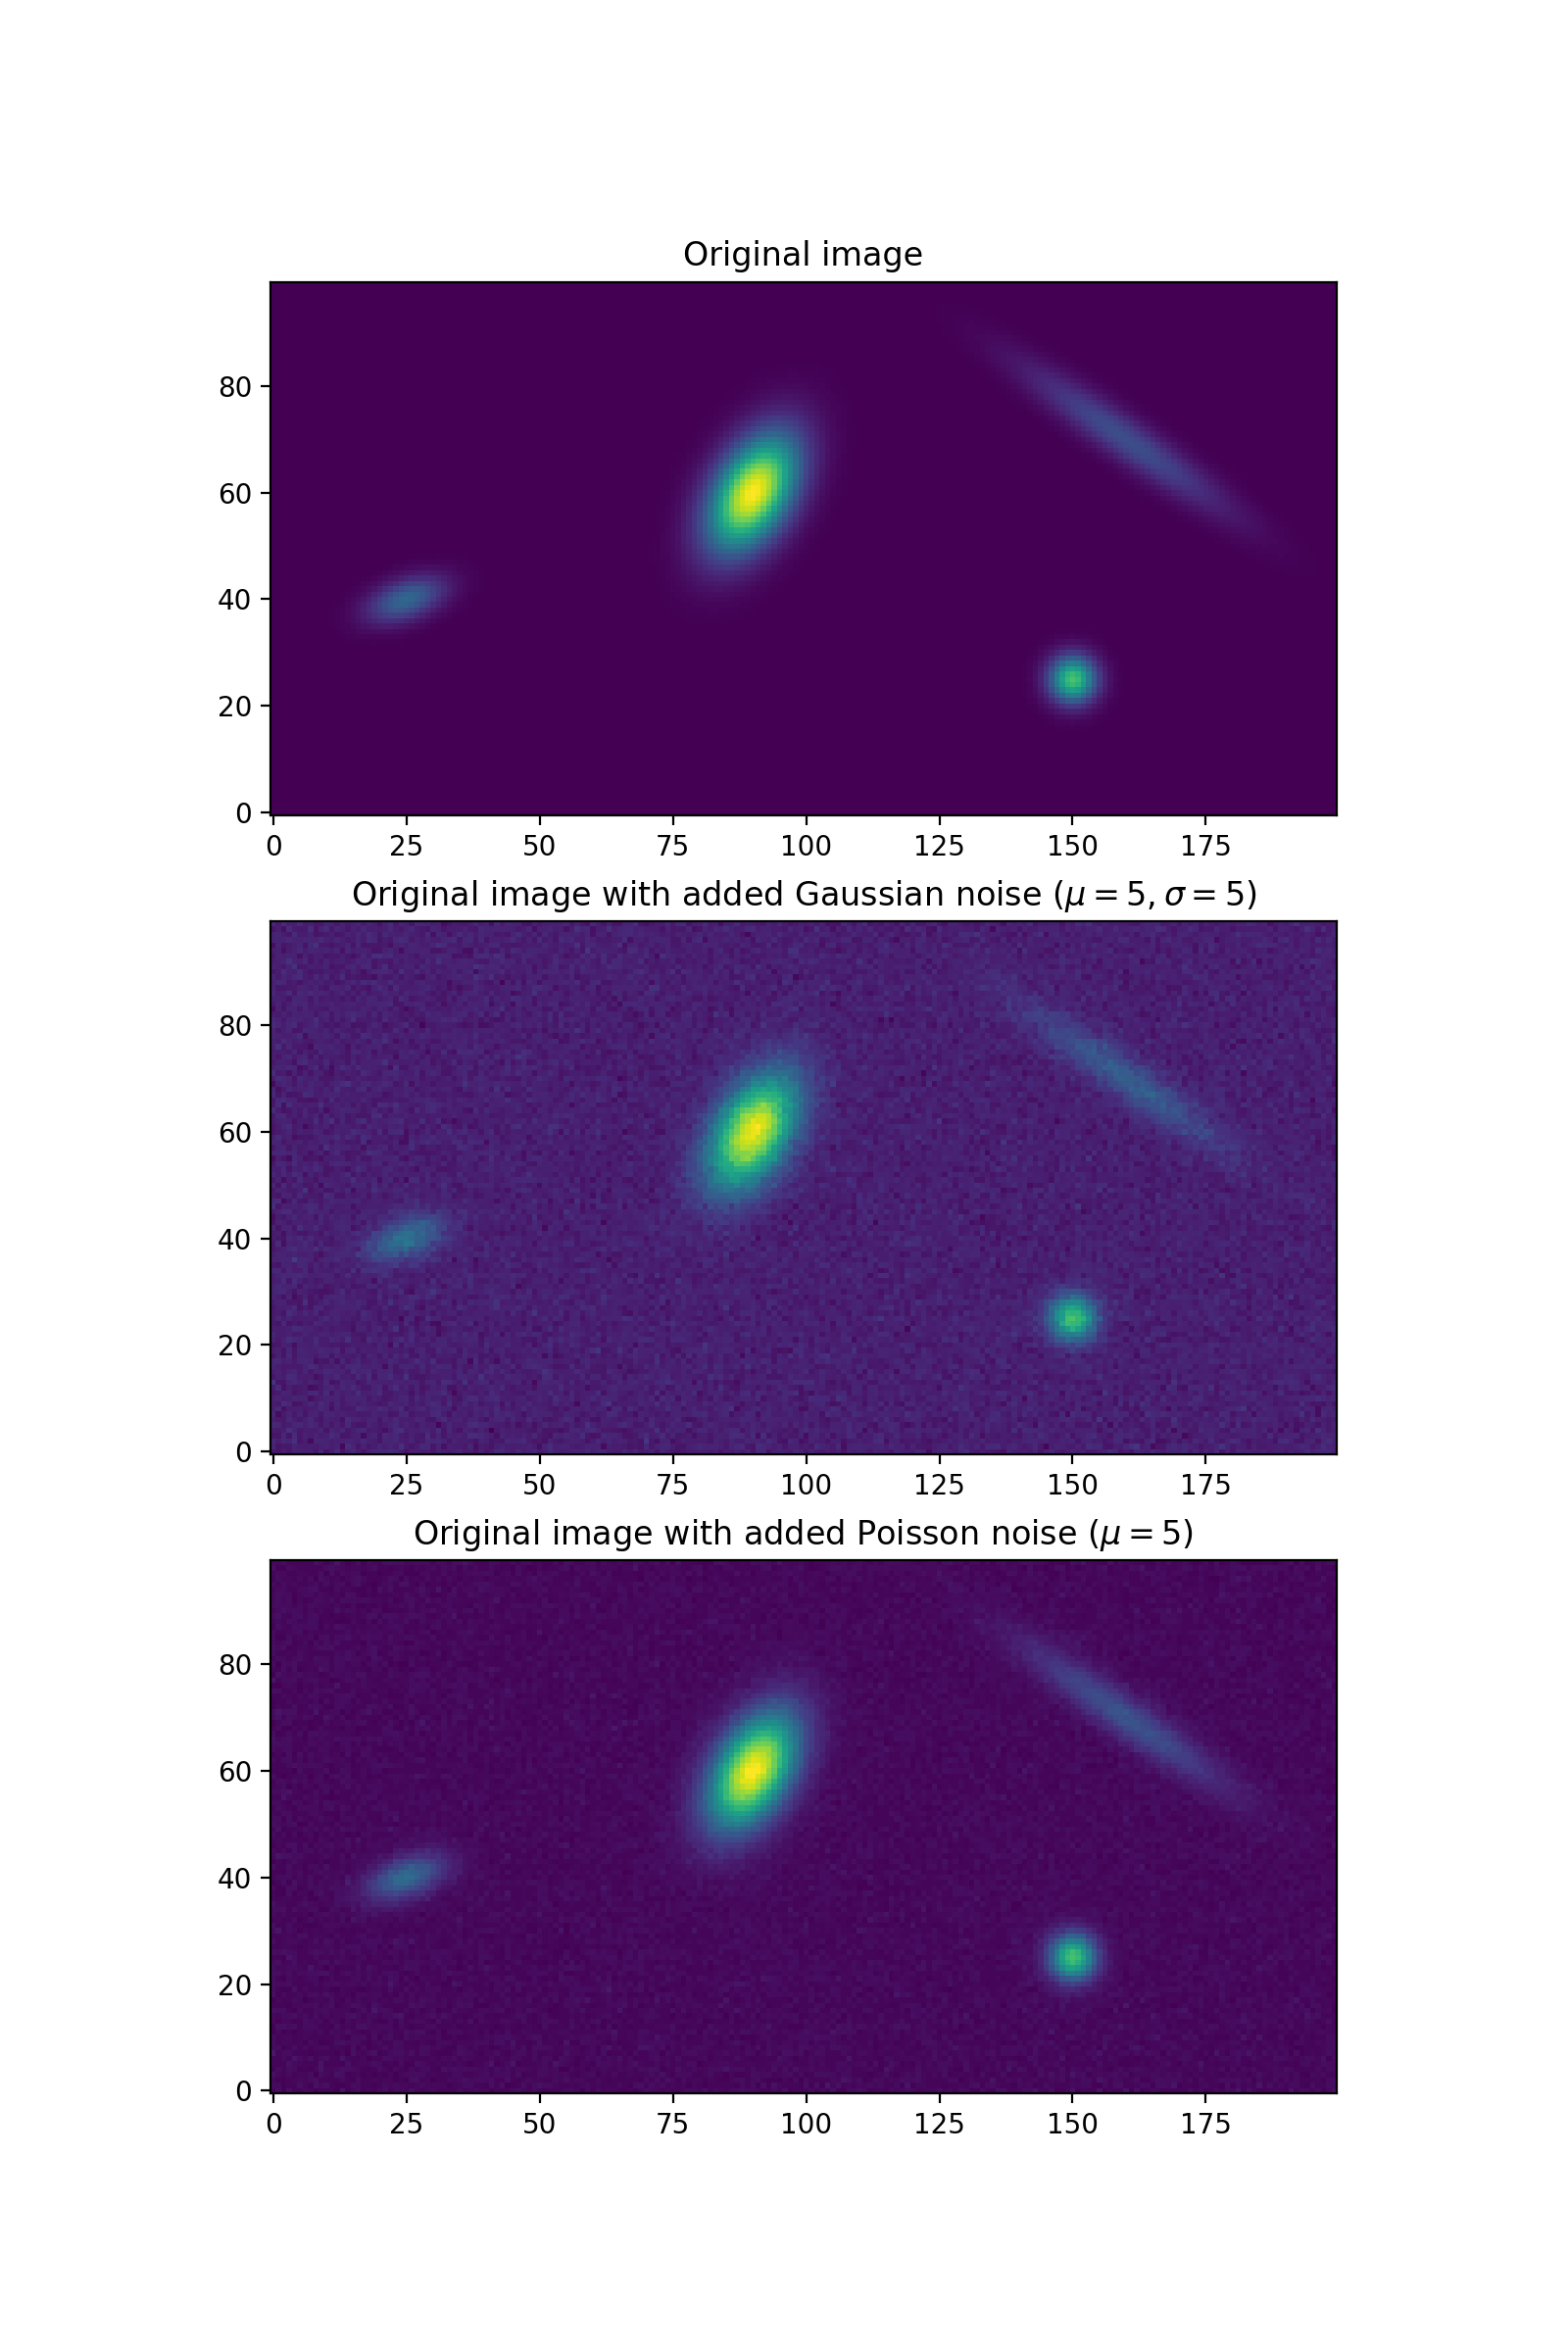
Make an image containing 2D Gaussian sources.
- Parameters:
- shape2-tuple of int
The shape of the output 2D image.
- source_table
Table Table of parameters for the Gaussian sources. Each row of the table corresponds to a Gaussian source whose parameters are defined by the column names. With the exception of
'flux', column names that do not match model parameters will be ignored (flux will be converted to amplitude). If both'flux'and'amplitude'are present, then'flux'will be ignored. Model parameters not defined in the table will be set to the default value.- oversamplefloat, optional
The sampling factor used to discretize the models on a pixel grid. If the value is 1.0 (the default), then the models will be discretized by taking the value at the center of the pixel bin. Note that this method will not preserve the total flux of very small sources. Otherwise, the models will be discretized by taking the average over an oversampled grid. The pixels will be oversampled by the
oversamplefactor.
- Returns:
- image2D
ndarray Image containing 2D Gaussian sources.
- image2D
Examples
import matplotlib.pyplot as plt
import numpy as np
from astropy.table import QTable
from photutils.datasets import (make_gaussian_sources_image,
                                make_noise_image)

# make a table of Gaussian sources
table = QTable()
table['amplitude'] = [50, 70, 150, 210]
table['x_mean'] = [160, 25, 150, 90]
table['y_mean'] = [70, 40, 25, 60]
table['x_stddev'] = [15.2, 5.1, 3., 8.1]
table['y_stddev'] = [2.6, 2.5, 3., 4.7]
table['theta'] = np.radians(np.array([145., 20., 0., 60.]))

# make an image of the sources without noise, with Gaussian
# noise, and with Poisson noise
shape = (100, 200)
image1 = make_gaussian_sources_image(shape, table)
image2 = image1 + make_noise_image(shape, distribution='gaussian',
                                   mean=5., stddev=5.)
image3 = image1 + make_noise_image(shape, distribution='poisson',
                                   mean=5.)

# plot the images
fig, (ax1, ax2, ax3) = plt.subplots(3, 1, figsize=(8, 12))
ax1.imshow(image1, origin='lower', interpolation='nearest')
ax1.set_title('Original image')
ax2.imshow(image2, origin='lower', interpolation='nearest')
ax2.set_title('Original image with added Gaussian noise'
              r' ($\mu = 5, \sigma = 5$)')
ax3.imshow(image3, origin='lower', interpolation='nearest')
ax3.set_title(r'Original image with added Poisson noise ($\mu = 5$)')
(
Source code,png,hires.png,pdf,svg)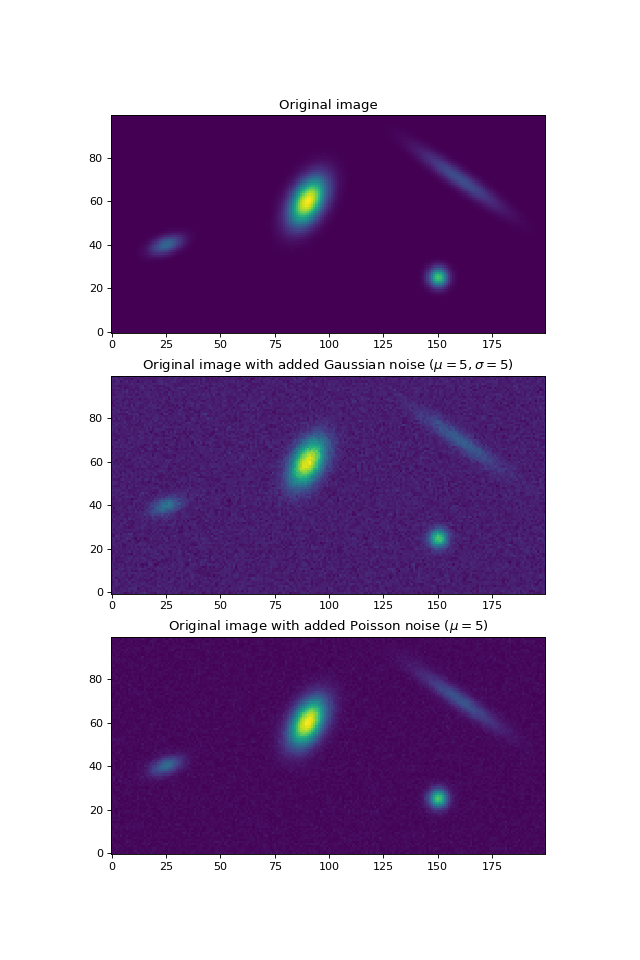